

Overview:
A real-time dealer performance dashboard gives OEMs up-to-date visibility into inquiry conversion, workshop turnaround, and dealer-level revenue without relying on outdated spreadsheets. By replacing manual, disconnected reporting with a single connected view, it enables OEM teams to identify underperforming dealers, adjust incentives, and address service bottlenecks within days rather than weeks. For US OEMs managing large dealer networks, this shift from static reports to live dealer analytics directly affects network profitability, customer experience, and how fast leadership can act on emerging problems.

Key Takeaways:
- A real-time dealer performance dashboard turns scattered dealer data into one live view of sales and service performance.
- OEMs relying on monthly or quarterly reports typically act on information that is already weeks old.
- Live dealer analytics let OEM teams flag underperforming dealers, service delays, and inventory gaps as they happen.
- Standardized OEM network reporting makes it possible to compare dealers fairly across regions and processes.
- Data-driven organizations are significantly more likely to acquire customers and stay profitable than those relying on delayed reporting.
- Platforms such as Intelli DMS bring sales, service, and dealer data together in a unified dashboard, giving OEMs a clear, centralized view for faster, more informed decision-making.
Get Real-Time Visibility Across Your Dealer Network. Book an Intelli DMS Demo
What is a Real-Time Dealer Performance Dashboard?
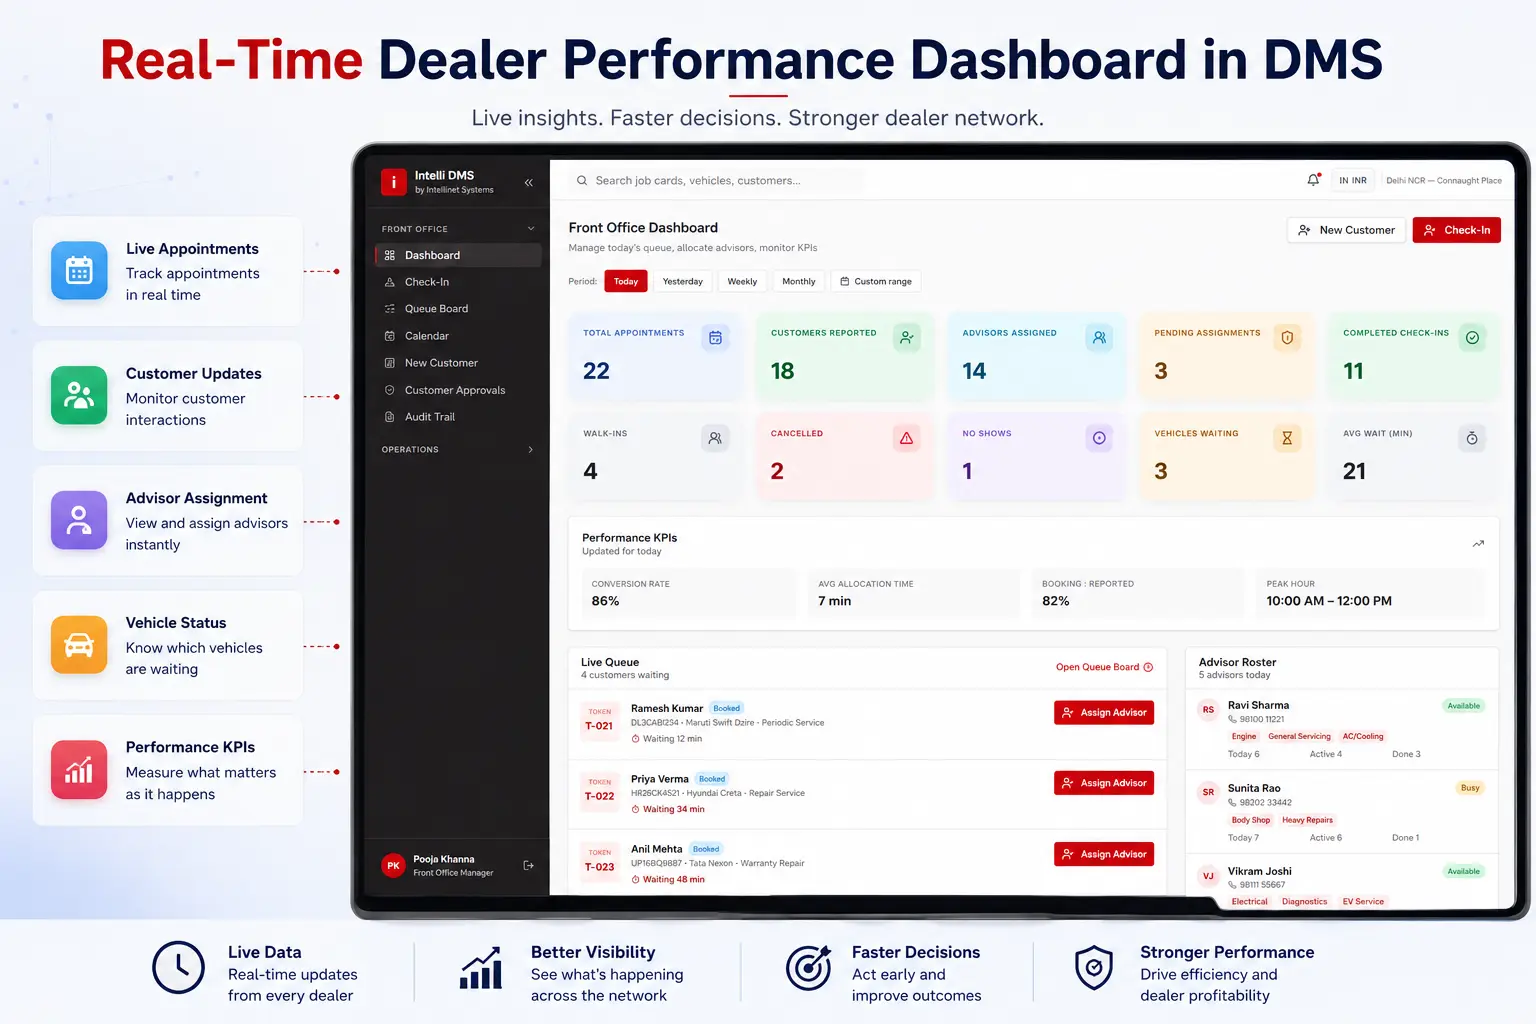
A real-time dealer performance dashboard in DMS is a live reporting tool that pulls sales, service, and inventory data directly from dealer operations and displays it as it happens. Instead of waiting for a dealer to submit a monthly report, OEM teams see inquiry counts, booking job card status, and revenue updates continuously.
Most dealer networks still run on a mix of inquiry registers, Excel sheets, phone calls, WhatsApp messages, manual job cards, and paper checklists. Each of these sits in its own silo, so someone at the OEM has to manually chase, compile, and reconcile the numbers before anyone can act on them. A real-time dashboard removes that manual step by connecting to the dealer’s day-to-day workflow and pulling the numbers automatically, without dealers having to fill out a separate report for head office.
Why Does Static Reporting Slow Down OEM Network Decisions?
Static, monthly dealer reports slow OEM decisions because the data is already outdated by the time it reaches head office. A dealer that misses targets in week one may not get flagged until the following month, by which point the lost revenue and customer impact are already locked in.
This delay compounds across a large network. When every dealer follows a slightly different sales and service process, and reporting formats vary from one dealer to the next, OEM teams end up spending more time cleaning and standardizing data than actually analyzing it. The result is what shows up across most traditional dealer operations: manual data entry, paper-based approvals, multiple follow-ups on the same issue, scattered information across systems, and decisions that arrive well after the problem has already affected customers.
How Do Live Dealer Analytics Change the Decision Cycle?
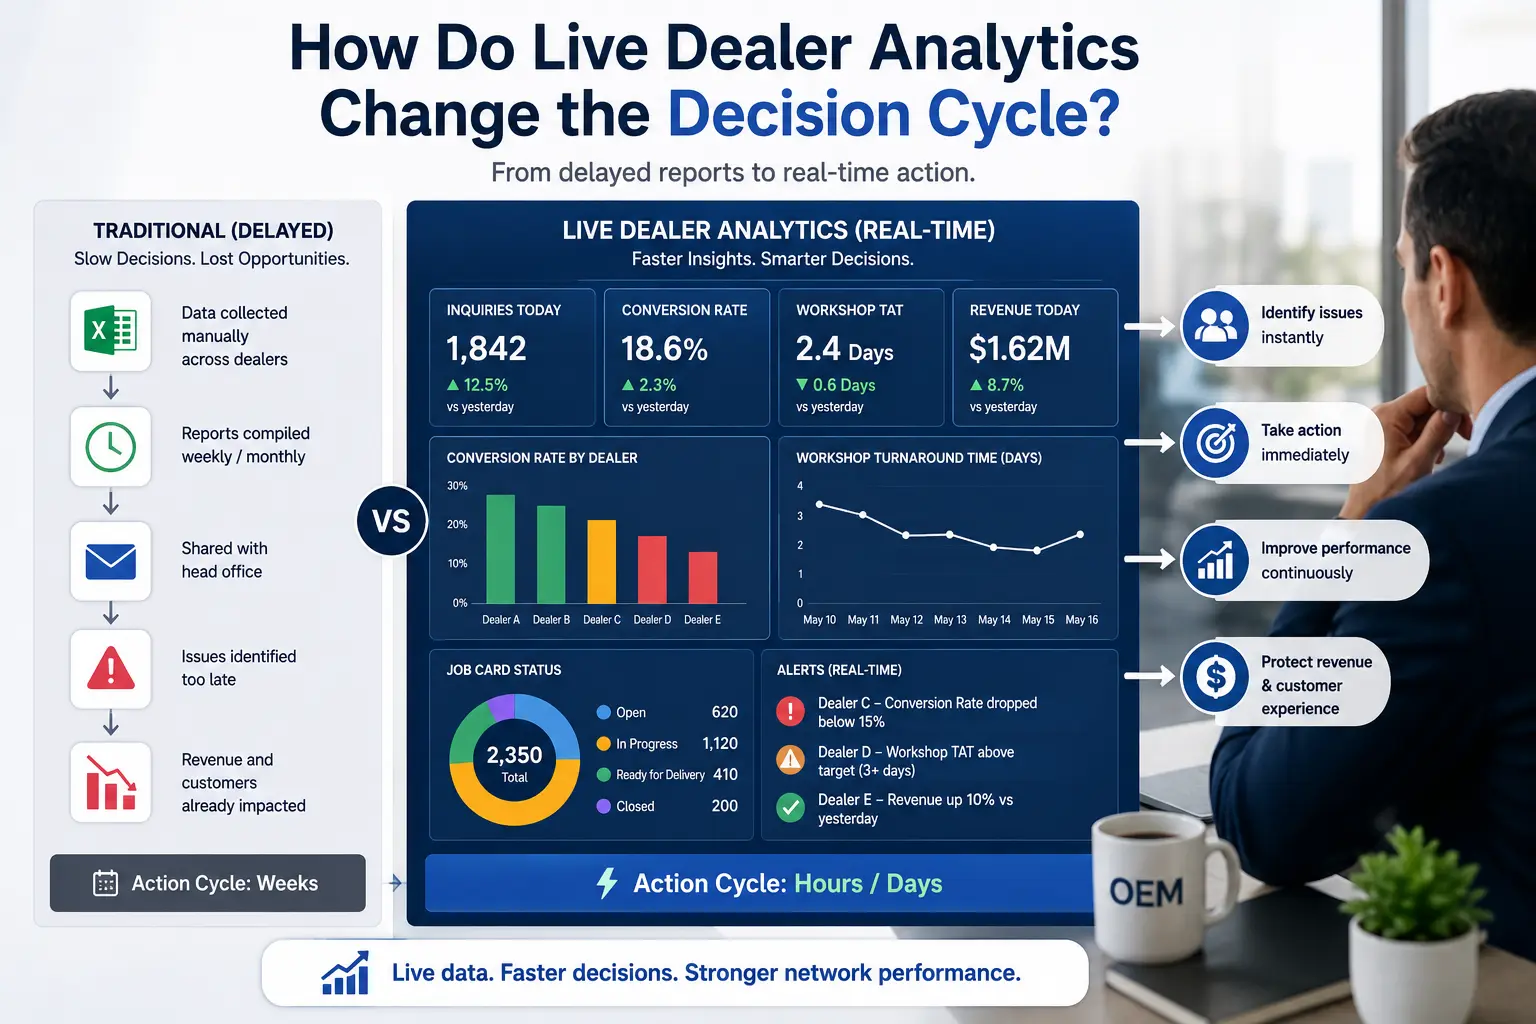
Live dealer analytics shorten the gap between something happening at a dealership and an OEM team acting on it. When inquiry conversion drops or workshop turnaround time rises, the dashboard flags it the same day, not at quarter-end, giving regional managers time to step in while the issue is still small.
This speed matters at scale. Research cited by McKinsey found that a one-standard-deviation increase toward data- and analytics-driven decision-making was correlated with about a 5–6% improvement in productivity. For an OEM network, the same principle applies at the dealer level: the sooner a performance dip is visible, the sooner it can be corrected before it affects sales targets or customer satisfaction scores.
This also changes what a business review looks like. Instead of a monthly meeting built around explaining what already happened, OEM and dealer teams can use the same live numbers to agree on what needs to happen next.
What Does OEM Network Reporting Look Like With Real-Time Data?
With real-time OEM network reporting, every dealer’s data sits on the same dashboard using the same metrics, so OEM teams can compare performance across regions instead of chasing separate spreadsheets from each dealer. That consistency is what makes fair, side-by-side benchmarking possible.
This directly addresses a common problem for OEMs: different dealers following different sales and service processes, disconnected applications for sales, service, warranty, and parts, and limited visibility into inquiry conversion or workshop productivity. When reporting is standardized at the source, an OEM can finally compare one dealer against another using the same definitions for a lead, a booking, or a completed job card.
What Metrics Should OEMs Track on a Dealer Dashboard?
The most useful dealer dashboards focus on a small set of metrics that tie directly to network health: how well inquiries turn into sales, how fast the workshop turns around a vehicle, and how much revenue each dealer generates. Tracking too many numbers at once makes the dashboard harder to act on, not easier.
- Inquiry-to-booking conversion rate by dealer and region
- Workshop turnaround time and technician productivity
- Job card status: open, in progress, ready for delivery, closed
- Revenue and billing trends across sales and service
- Warranty claim volume and approval turnaround
- Customer follow-up completion and satisfaction feedback
Together, these metrics give an OEM a single, comparable picture of how each dealer is performing on both the sales floor and in the service bay.
What Is the Business Impact of Faster Network Decisions?
The business impact of a real-time dealer performance dashboard is reflected in three key areas: faster corrective action, greater process consistency across the dealer network, and more efficient use of OEM resources by reducing the time spent chasing and consolidating reports.
When OEM teams can see conversion and turnaround numbers in real time, they can step in with training, staffing, or inventory support before a quarter closes rather than after. Standard metrics across dealers also make it easier to enforce shared operating procedures, since every dealer is being measured the same way. And because the dashboard pulls data automatically, OEM analysts spend less time compiling reports and more time acting on the report’s findings, which supports better dealer profitability and a more consistent customer experience across the network.
How Intelli DMS Powers Real-Time Dealer Dashboards
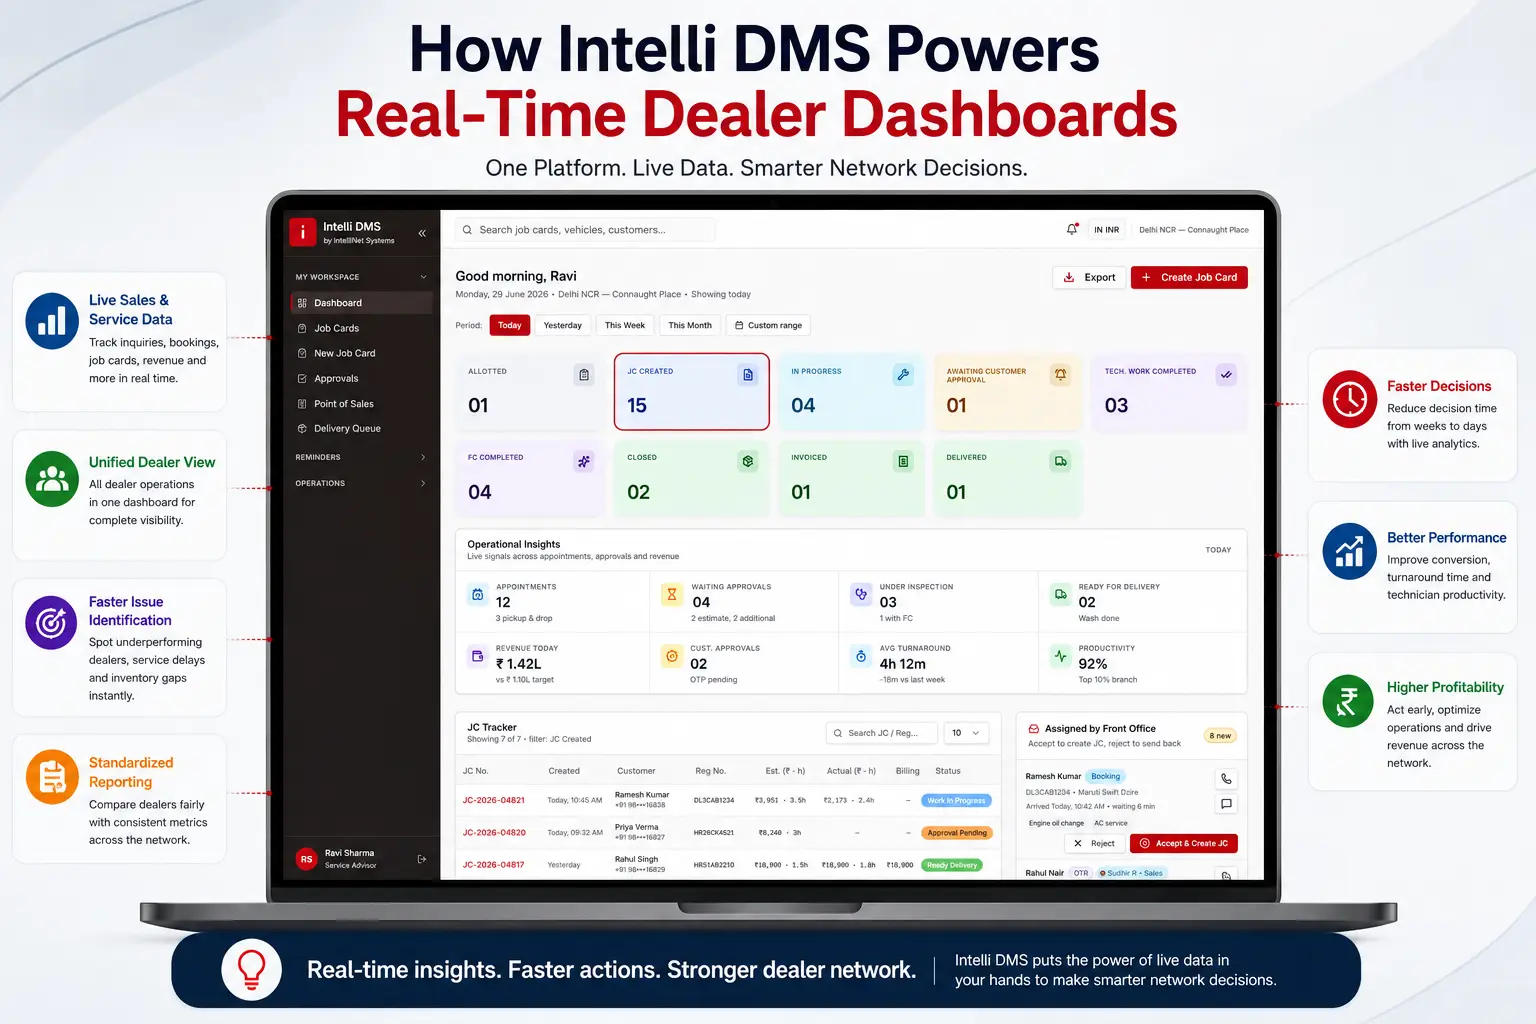
Intelli DMS is a dealer management system that connects sales and service data from across a dealer network into one live dashboard, so OEM teams do not have to piece together numbers from spreadsheets, calls, and paper job cards. It covers the dealership lifecycle from first customer inquiry through booking, workshop operations, billing, and delivery.
On the sales side, it tracks inquiries, test drives, quotations, bookings, and vehicle delivery in one workflow. On the service side, it manages appointments, job cards, workshop and technician assignments, parts and inventory, and warranty operations. Both sides feed into dashboards built for OEM-level reporting, showing conversion rates, workshop turnaround, technician productivity, and revenue by dealer in real time. Because every dealer runs through the same platform, the numbers arrive already standardized, which is what makes network-wide comparison possible in the first place.
Conclusion
Dealer networks generate a constant stream of sales and service data, but that data only helps an OEM if it arrives fast enough to act on. A real-time dealer performance dashboard closes that gap by turning scattered inquiry registers, job cards, and spreadsheets into one live, standardized view of network performance.
For OEMs, this means catching underperforming dealers earlier, enforcing consistent processes across regions, and making network decisions based on what is happening now rather than what happened last month. As dealer networks grow, live dealer analytics and consistent OEM network reporting stop being a convenience and become the baseline for keeping a network profitable and competitive.
Book a demo to see how Intelli DMS brings sales, service, and dealer performance data into one real-time dashboard for OEM decision-making.
Frequently Asked Questions
What data does a real-time dealer performance dashboard track?
It typically tracks inquiry-to-booking conversion, workshop turnaround time, technician productivity, billing and revenue, warranty claim status, and customer follow-up activity. These metrics update as dealer teams work, rather than being compiled and submitted at the end of a reporting period.
How is a real-time dashboard different from a monthly dealer report?
A monthly report summarizes what already happened, often weeks after the fact. A real-time dashboard shows the same categories of data as they occur, so an OEM can respond to a drop in conversion or a service delay while it is still developing, not after the reporting cycle closes.
Can OEMs compare dealers across different regions with live analytics?
Yes, as long as every dealer reports through the same platform using the same metric definitions. Standardized OEM network reporting enables meaningful comparisons across regions, allowing OEMs to evaluate dealer performance without manually reconciling inconsistent spreadsheet formats.
Does a real-time dealer dashboard help reduce service turnaround time?
It helps by making delays visible immediately. When a job card sits open longer than expected, or a technician's workload is unbalanced, the dashboard surfaces it the same day, allowing service managers to reassign work before the delay affects the customer's delivery date.
How long does it take to roll out a dealer dashboard across a network?
Timelines depend on network size and how many dealers need onboarding, but because the dashboard pulls from a shared platform rather than requiring dealers to build custom reports, rollout is largely a matter of onboarding dealers onto the system rather than building new reporting infrastructure for each one.


Explore More Insights






.webp)


About the Author


Nishant Sharma
Nishant Sharma is the Head of Demand Generation at Intellinet Systems, specializing in B2B marketing, sales, digital transformation, and automotive aftermarket solutions. He shares insights on emerging technologies, industry trends, and strategies that help OEMs and businesses improve operational efficiency, customer experience, and aftermarket growth.


