

Overview: PDI quality is measured through a defined set of KPIs, including first-time pass rate, defect detection rate, rectification turnaround time, checklist compliance, and dealer-to-dealer variance. OEMs that track these metrics consistently catch more defects before delivery, reduce warranty costs, and hold every dealer to the same inspection standard regardless of location. Aftersales heads, service directors, and quality managers use this data to spot underperforming dealers early, standardize inspections across the network, and replace scattered paper checklists with a single, benchmarked view of inspection quality, the kind a platform like Intelli PDI is built to provide.

Key Takeaway
- PDI quality is the measurable consistency and thoroughness of pre-delivery inspections across a dealer network, not just a pass or fail stamp.
- Core KPIs include first-time pass rate, defect detection rate, checklist completion rate, rectification cycle time, and repeat defect rate.
- Dealer network quality metrics let OEMs compare inspection performance across regions and identify outlier dealers before problems reach customers.
- Digital PDI checklists with photo evidence, dashboards, and compliance reporting remove the guesswork from manual, paper-based inspections.
- A structured measurement system, not a single metric, is what protects warranty costs and brand reputation at scale.
What is PDI Quality and Why It Matters for OEMs
PDI quality refers to how consistently and thoroughly a dealer network inspects vehicles before delivery, measured against a defined standard rather than a simple pass or fail checkbox. It matters because inconsistent PDI execution directly drives up warranty claims, comebacks, and customer dissatisfaction.
A vehicle can pass PDI on paper and still reach the customer with a defect that a rushed or incomplete inspection missed. This is why OEMs are moving away from treating PDI as a compliance formality and instead treating it as a quality function with its own data and accountability.
The financial stakes are significant. J.D. Power's 2025 U.S. Customer Service Index Study found that 12% of repairs are not completed correctly on the first visit, with dealers citing unresolved problems and missing parts as the top cause. Many of these comebacks track back to inspection gaps that a stronger PDI process would have caught earlier.
For OEMs, PDI quality connects directly to three business outcomes:
- Warranty cost control: Defects caught before delivery cost far less to fix than post-sale claims.
- Customer retention: A defect-free delivery experience builds the trust that keeps customers coming back for service.
- Brand consistency: Every dealer in the network should deliver the same inspection standard, regardless of size or region.
The Core PDI Quality Metrics Every Aftersales Head Should Track
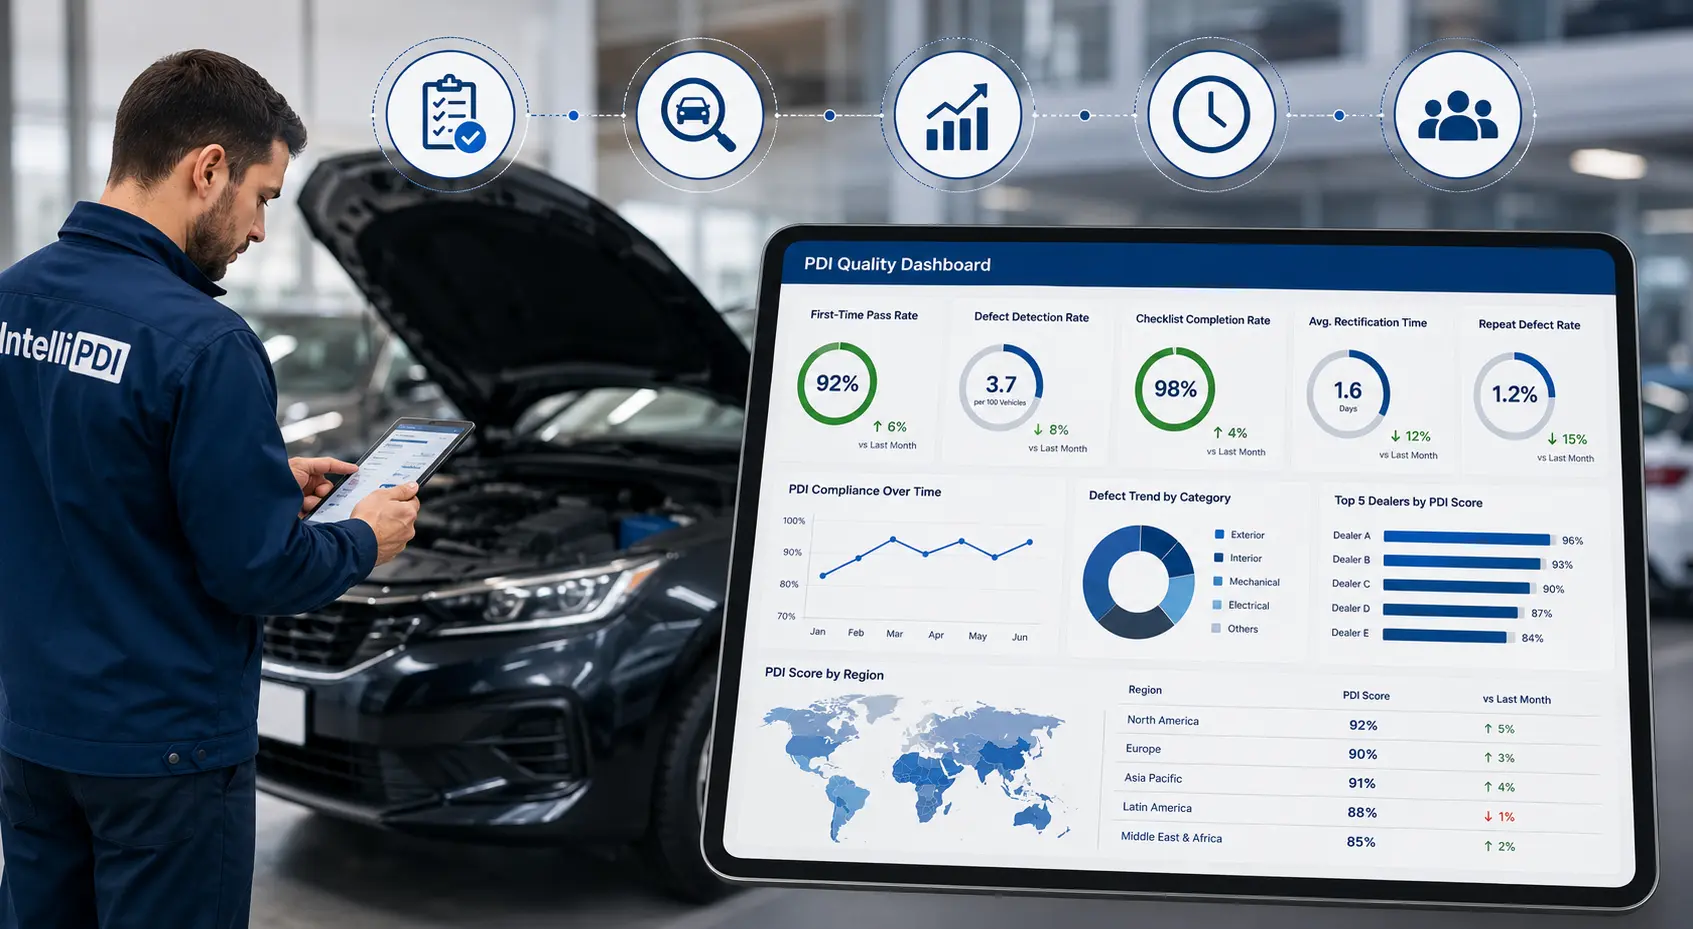
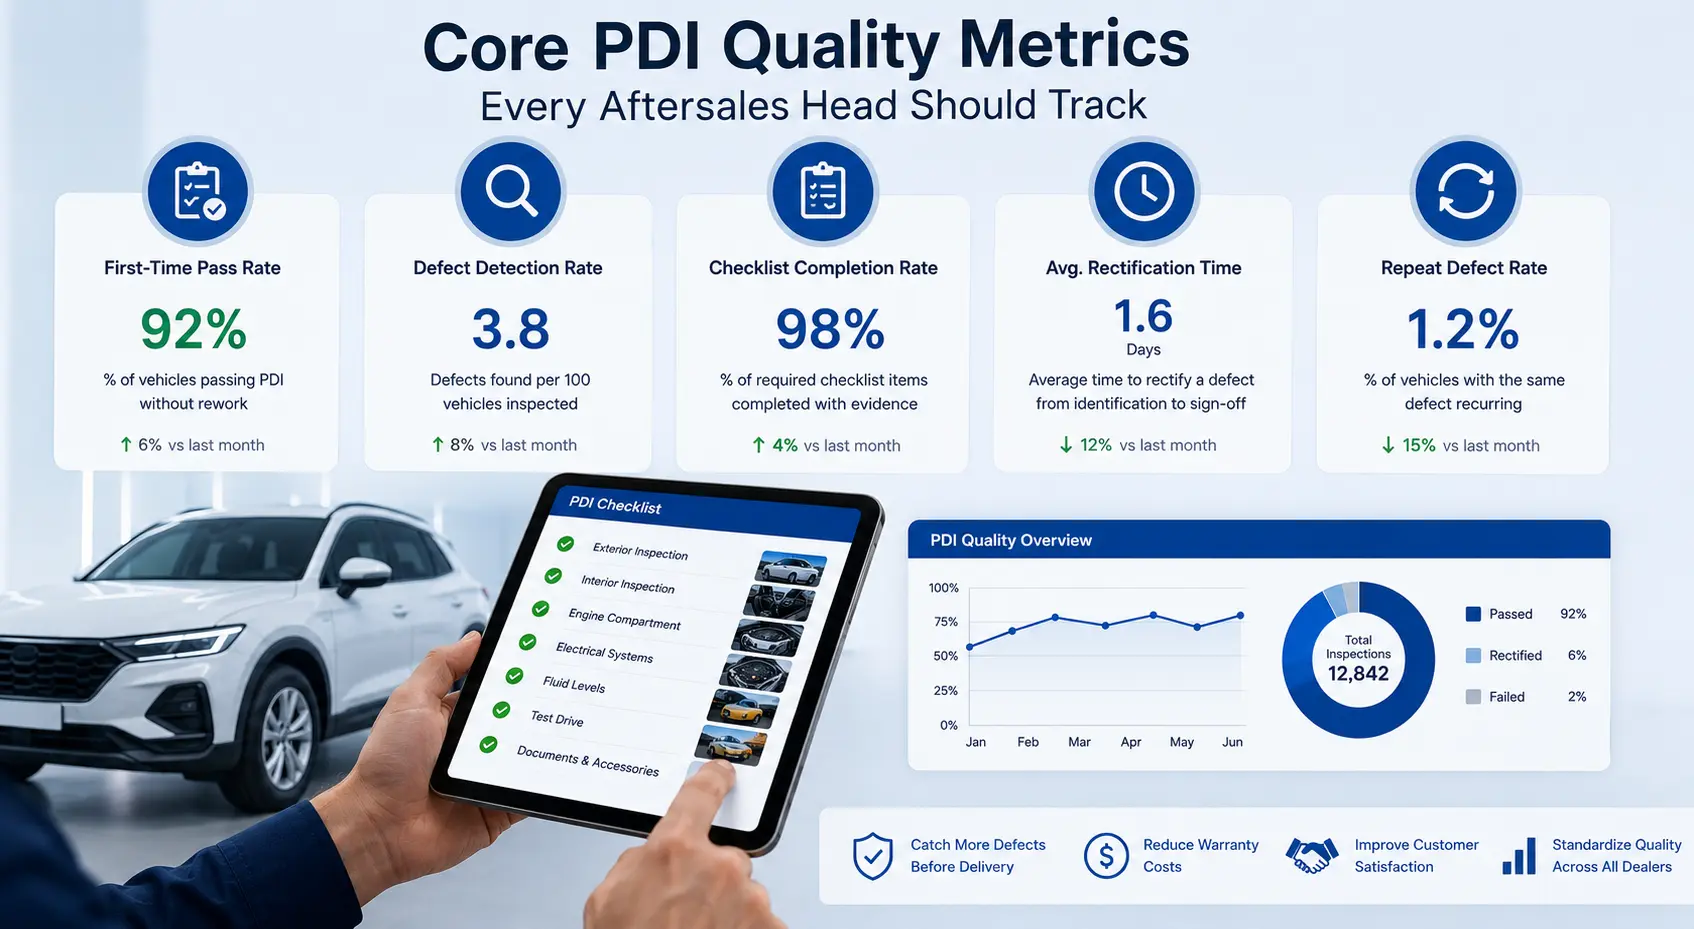
The Core PDI quality metrics are first-time pass rate, defect detection rate, checklist completion rate, average rectification time, and repeat defect rate. Together, these five numbers show whether inspections are thorough, timely, and actually preventing defects from reaching customers.
Each metric answers a different question about the health of the PDI process:
- First-Time Pass Rate: The percentage of vehicles that pass PDI without rework. A low rate may indicate incoming quality issues related to transportation or manufacturing, rather than dealer performance alone.
- Defect Detection Rate: The number of defects found per 100 vehicles inspected. This tells you whether technicians are actually finding problems or simply rubber-stamping checklists.
- Checklist Completion Rate: The percentage of required checklist items completed and documented, including photo evidence, for every vehicle.
- Average Rectification Time: How long it takes to fix a defect once it is flagged during PDI, from identification to sign-off.
- Repeat Defect Rate: How often the same defect type recurs across vehicles or dealers, which usually signals a training gap or a recurring supplier issue.
Tracking these five metrics together prevents a common blind spot: a dealer can show a high pass rate while quietly skipping checklist steps. Comparing the pass rate with the checklist completion rate quickly highlights any discrepancies.
Pre-Delivery Inspection KPIs That Signal Dealer Performance
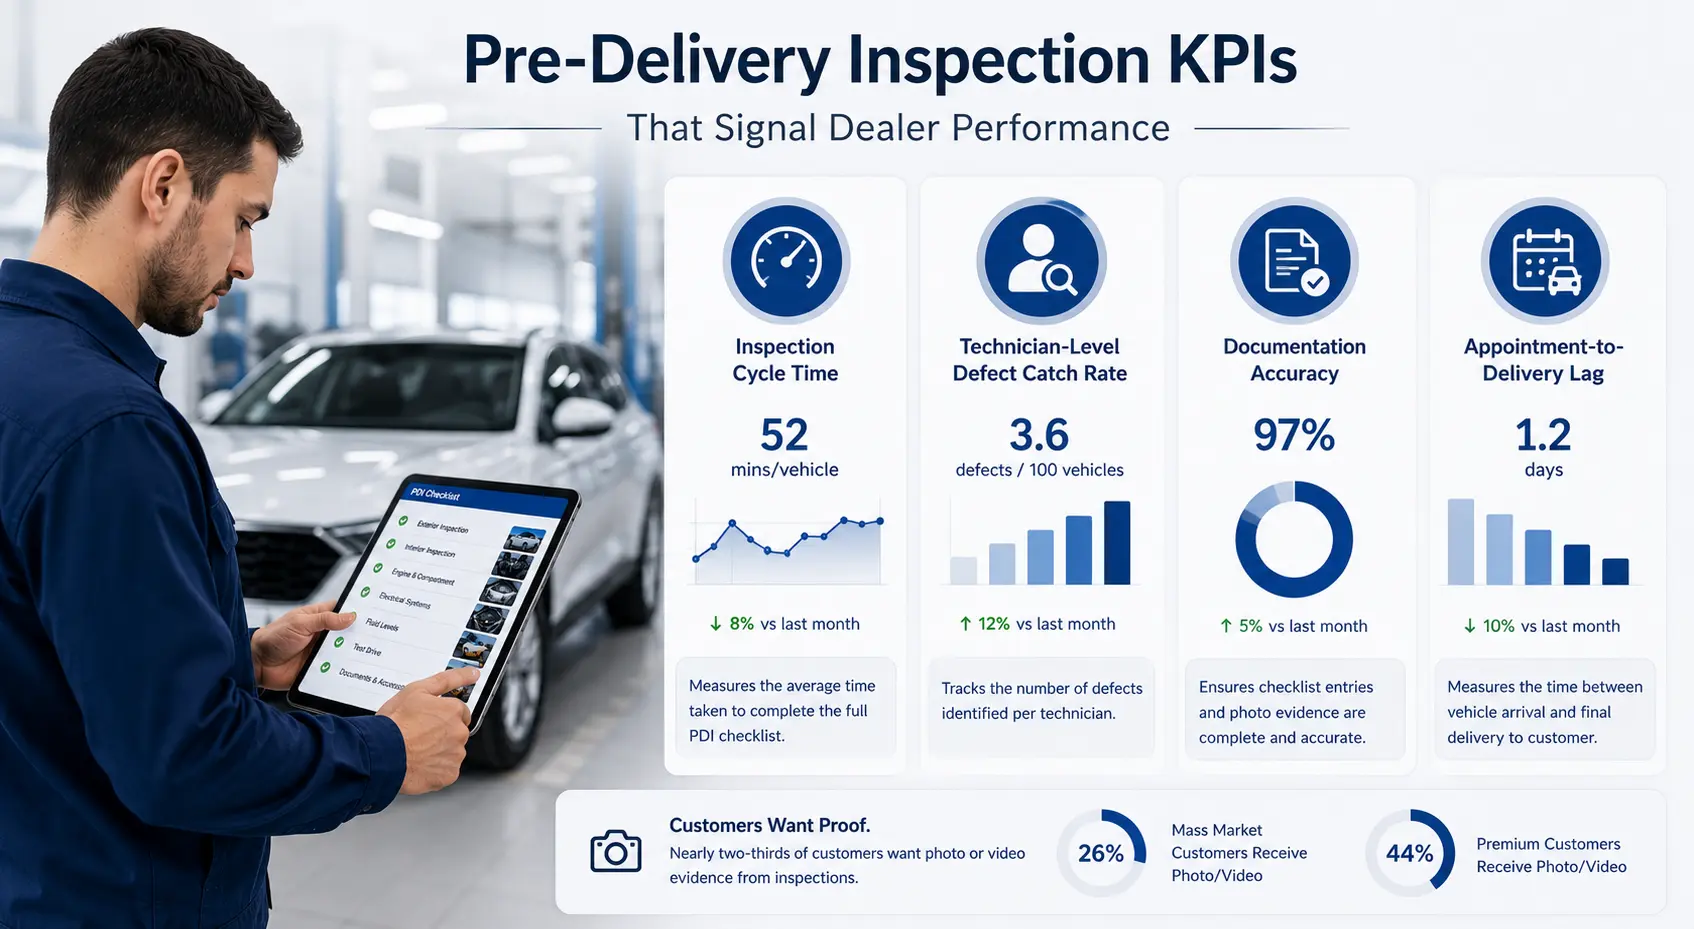
At the individual dealer level, key pre-delivery inspection (PDI) KPIs include inspection cycle time, technician defect detection rate, documentation accuracy, and appointment-to-delivery lead time. These KPIs isolate performance issues to a specific dealer, team, or even technician, rather than treating the network as one average.
Dealer-level service performance is already under pressure across the industry. J.D. Power's 2026 Customer Service Index found that only 26% of customers experienced nine or ten of the top service KPIs measured in the study, indicating inconsistent execution even in well-established service processes. PDI, being upstream of service, carries the same risk if it is not measured with the same rigor.
Key pre-delivery inspection KPIs to track at dealer level:
- Inspection Cycle Time: Measures the time required to complete the full PDI checklist for each vehicle. Sudden drops in cycle time without a corresponding rise in defect catches can indicate corners being cut.
- Technician-Level Defect Catch Rate: Defects identified per technician, useful for spotting training needs
- Documentation Accuracy: Whether photo evidence and checklist entries match the actual vehicle condition, verified through spot audits.
- Appointment-to-Delivery Lag: Measures the time between vehicle arrival and customer delivery, ensuring the PDI process is completed without becoming a bottleneck.
Customers increasingly expect visual proof of quality checks. In the 2026 CSI Study, almost two-thirds of customers said they want photo or video evidence from inspections, yet only 26% of mass market and 44% of premium customers actually receive it. Applying that same expectation to PDI, backed by photo evidence tied to each checklist item, gives OEMs and dealers a documented record they can stand behind.
Dealer Network Quality Metrics for Benchmarking Across Locations
Dealer network quality metrics compare PDI performance across every dealership in a region or country, using standardized scoring so OEMs can rank, benchmark, and coach underperforming locations. Without network-wide benchmarking, a quality issue at one dealer stays invisible until it surfaces as a warranty claim or a customer complaint.
Effective benchmarking requires a shared scorecard applied uniformly, covering:
- Network Average Pass Rate: A baseline to identify dealers falling below standard.
- Variance in Defect Types: Whether certain defect categories cluster in specific regions, often pointing to logistics or transport damage rather than dealer error.
- Compliance Audit Scores: Results from periodic or randomized PDI audits, cross-checked against submitted checklists.
- Time-to-Resolution by Dealer: How quickly each location closes out flagged defects compared to the network average.
Vehicle quality itself varies significantly by brand before it even reaches the dealer. J.D. Power's 2025 Initial Quality Study found the industry average was 192 problems per 100 vehicles, while the top-ranked brand recorded just 166. This is a reminder that dealer network quality metrics need to separate manufacturing-origin defects from inspection or handling defects at the dealership, so coaching efforts target the right root cause.
A standardized dashboard that consolidates data from every dealer's digital PDI checklist, rather than emailed spreadsheets or paper records, enables OEMs to benchmark dealer performance monthly instead of just once a year. Intelli PDI is built for this exact use case. It consolidates digital checklists, photo evidence, and defect logs from every dealership into a centralized analytics dashboard, enabling quality managers to benchmark dealer performance side by side instead of manually compiling reports.
How to Build a PDI Quality Measurement System
Building a PDI quality measurement system means defining standard checklists, digitizing data capture, setting KPI thresholds, and reviewing dealer performance on a fixed schedule. The goal is a repeatable process, not a one-time audit.
Follow these implementation steps:
- Standardize the checklist: Create a standardized master PDI checklist for each vehicle category to ensure every dealer inspects the same items in the same sequence.
- Digitize data capture: Replace paper forms with digital checklists that require photo evidence for critical checkpoints and time-stamp every entry.
- Set KPI thresholds: Define acceptable thresholds for pass rate, cycle time, and defect rate so that deviations automatically trigger a review.
- Centralize the data: Centralize PDI submissions from every dealership into a single dashboard, giving quality managers real-time visibility into network-wide performance and trends rather than isolated dealer reports.
- Run scheduled review: Hold monthly or quarterly reviews with underperforming dealers, using the data to guide coaching rather than guesswork.
- Audit for compliance: Periodically spot-check submitted checklists against physical vehicles to confirm photo evidence and entries are accurate.
This is where a platform like Intelli PDI fits naturally into the process. It replaces paper checklists with digital PDI forms, captures photo evidence at each checkpoint, and rolls every dealer’s data into dashboards that show pass rates, defect trends, and compliance scores side by side. Aftersales teams get a single view of network performance instead of chasing spreadsheets from each location.
Common Pitfalls That Undermine PDI Quality Programs
The most common pitfalls are inconsistent checklists across dealers, missing photo evidence, delayed defect reporting, and treating PDI as a one-time compliance task instead of an ongoing quality metric. Each of these gaps reduces the reliability of the reported data.
Watch for these warning signs in your own network:
- Checklist drift: Dealers modifying or shortening the standard checklist over time without approval.
- No photo evidence: checklist items marked complete with no visual proof attached.
- Delayed defect logging: Defects reported days after inspection, which distorts rectification time metrics.
- Siloed data: Each dealer keeping its own records, making network-wide comparison impossible.
- No feedback loop: Defect data collected but never routed back to manufacturing or logistics teams to fix root causes.
Each of these issues is largely a data and process problem, not a technician skill problem. Which is why fixing them usually starts with the system dealers use to record PDI, not with retraining alone.
Conclusion
PDI quality is not a single inspection result. It is a set of connected metrics- first-time pass rate, defect detection rate, checklist completion, rectification time, and repeat defect rate- that together show whether a dealer network is consistently delivering defect-free vehicles. Measuring these in isolation, or relying on paper checklists and dealer self-reporting, leaves OEMs blind to the gaps that eventually surface as warranty claims and lost customer trust. A standardized checklist, digital data capture, and a centralized dashboard, the kind Intelli PDI is built to provide, turn PDI from a compliance task into a measurable quality function that aftersales heads, service directors, and quality managers can actually manage and improve, dealer by dealer, across the entire network.
Standardize PDI quality across your dealer network with Intelli PDI. Book a demo and get real-time visibility into inspections, compliance, and quality KPIs from a single dashboard.
FAQs
What is PDI quality in the automotive industry?
PDI quality refers to how thoroughly and consistently a dealership inspects a new vehicle before delivery, measured against defined checklists and KPIs rather than a simple pass or fail outcome. It covers exterior and interior checks, mechanical and electrical systems, fluid levels, and a test drive. High PDI quality means defects are caught and fixed before the customer takes delivery, which reduces warranty claims and comebacks.
Which PDI quality metrics matter most for OEMs?
The metrics that matter most are first-time pass rate, defect detection rate, checklist completion rate, average rectification time, and repeat defect rate. Tracking these together shows whether inspections are thorough and whether defects are actually being fixed, not just logged. OEMs that monitor all five, rather than just pass rate alone, catch skipped checklist steps that a single metric would miss.
How often should OEMs review dealer PDI performance?
Most OEMs review dealer-level PDI performance monthly, with a deeper network-wide benchmarking review each quarter. Monthly reviews catch emerging issues early, such as a sudden drop in cycle time or a spike in a specific defect type. Quarterly reviews are better suited to benchmarking dealer performance and refining KPI thresholds based on long-term trends.
Can digital PDI checklists really replace paper-based inspections?
Yes. Digital checklists capture the same inspection points as paper forms while adding time stamps, mandatory photo evidence, and automatic data routing to a centralized dashboard. This eliminates the manual effort of collecting and compiling PDI reports from every dealer, enabling quality teams to identify compliance gaps or missing evidence in real time rather than during annual audits.
How does PDI quality affect warranty costs?
Defects identified during PDI can be resolved before vehicle delivery, reducing the cost of addressing the same issues later as warranty claims. J.D. Power's 2025 CSI Study found that 12% of repairs are not completed correctly on the first visit, and a portion of those repeat visits trace back to issues that a stronger PDI process could have caught earlier.


Explore More Insights







.webp)


About the Author


Chandra Shekhar
Chandra Shekhar is the Senior Manager, Strategy & Business Development at Intellinet Systems. With over a decade of experience in the automotive industry, Chandra Shekhar has led digital transformation and aftersales strategy initiatives for OEMs across multiple markets. His background combines deep industry knowledge with a practical understanding of how technology can solve real operational challenges. He focuses on making complex ideas clear and relevant for automotive and aftermarket professionals navigating ongoing change.


